 Dan Druce · Portfolio
1. The Dashboard
Below is an embedded version of the dashboard. You can also access the dashboard here.
2. Project Overview
Analysis of house prices in Bath, their affordability and market activity from 1995 to 2025
2.1 Objective for House Dashboard
I have made this project to analyse historic house price data and inflation adjusted averages to explore house prices, income ratios and sales of houses in Bath over time. This analysis is designed to give evidence for a prospective buyer of a property in Bath.
I aim to answer these questions:
- How have house prices changed over time in Bath using real time and inflation adjusted values?
- How affordable is Bath relative to local incomes?
- How do prices vary by property type, tenure and postcode?
- Do current market conditions favour investment, renting or long-term occupiers?
- Weston and Bear Flat have been suggested as good areas to move to for families. Are either of these possible as someone moving from Ealing on a budget of £425k? (The average flat from Dashboard #1)
2.2 Tools & Methodology
- Excel was used for initial data exploration and light preparation of the smaller data files.
- I accessed my database using SQL Server Management System (SSMS). This was used for data exploration, creating relationships between my data and preparing data for manipulation. It supported ongoing checks to validate results throughout the dashboarding process.
- Tableau was used to build comprehensive dashboards with distinct analytical focuses:
- Understanding house prices within Bath
- Understanding the change over time of house prices in Bath
2.3 Table Structure for Housing Data
This project analyses the entirety of the Price Paid Data supplied by HM Land Registry. This contains all the house sales of the UK from 1995 until 2025 [1]. It was approximately 5.2GB and too large to import directly as a flat file like most other tables used. I created a staging table in SQL Server Management Studio (SSMS) with low restrictions to each columns and bulk imported the CSV. I wrote a query to inset the data into the Fact_PPD table. The 16 columns were a mix of DATETIME, INT, NVARCHAR(x), VARCHAR(x). I also had to bulk import the ONS Postcode Directory [2] in a similar way to create DimGeog.
All links to data is available within the appendices. Here is a selection of my most used columns from the selected tables.
I removed all sales from Fact_PPD with the Category Type B, as these houses are not typical sales; such as repossessions. I also removed houses of Property Type O (Other); I was focused on residential properties and these houses tended to be expensive properties, the most expensive I researched was a plot bought by Lidl on which they built a superstore.
| Column Name | Description/Entry | Table |
|---|---|---|
| Year | Year(Int) | DimDate |
| Price | Price of sale | Fact_PPD [1] |
| Property Type | Semi Detached, Flat, Detached, Terraced | Fact_PPD [1] |
| Tenure | Freehold, Leasehold | Fact_PPD [1] |
| Old/New Build | New Build, Existing | Fact_PPD [1] |
| Postcode | Cleaned postcode format | DimGeog [2] |
| Longitude | Longitude ordinate of the postcode | DimGeog [2] |
| Latitude | Latitude ordinate of the postcode | DimGeog [2] |
| Town/City | Names of towns and cities mapped to Postcode using SAGA GIS and region polygons [9] | DimGeog [9] |
| Region | Regions in England | DimRegion [2] |
| Inflation Standardised Price | Calcuated from the UKHPI Index | Fact_UKHPI [6] |
| Catagory Type | A (regular house sales) | Fact_PPD [1] |
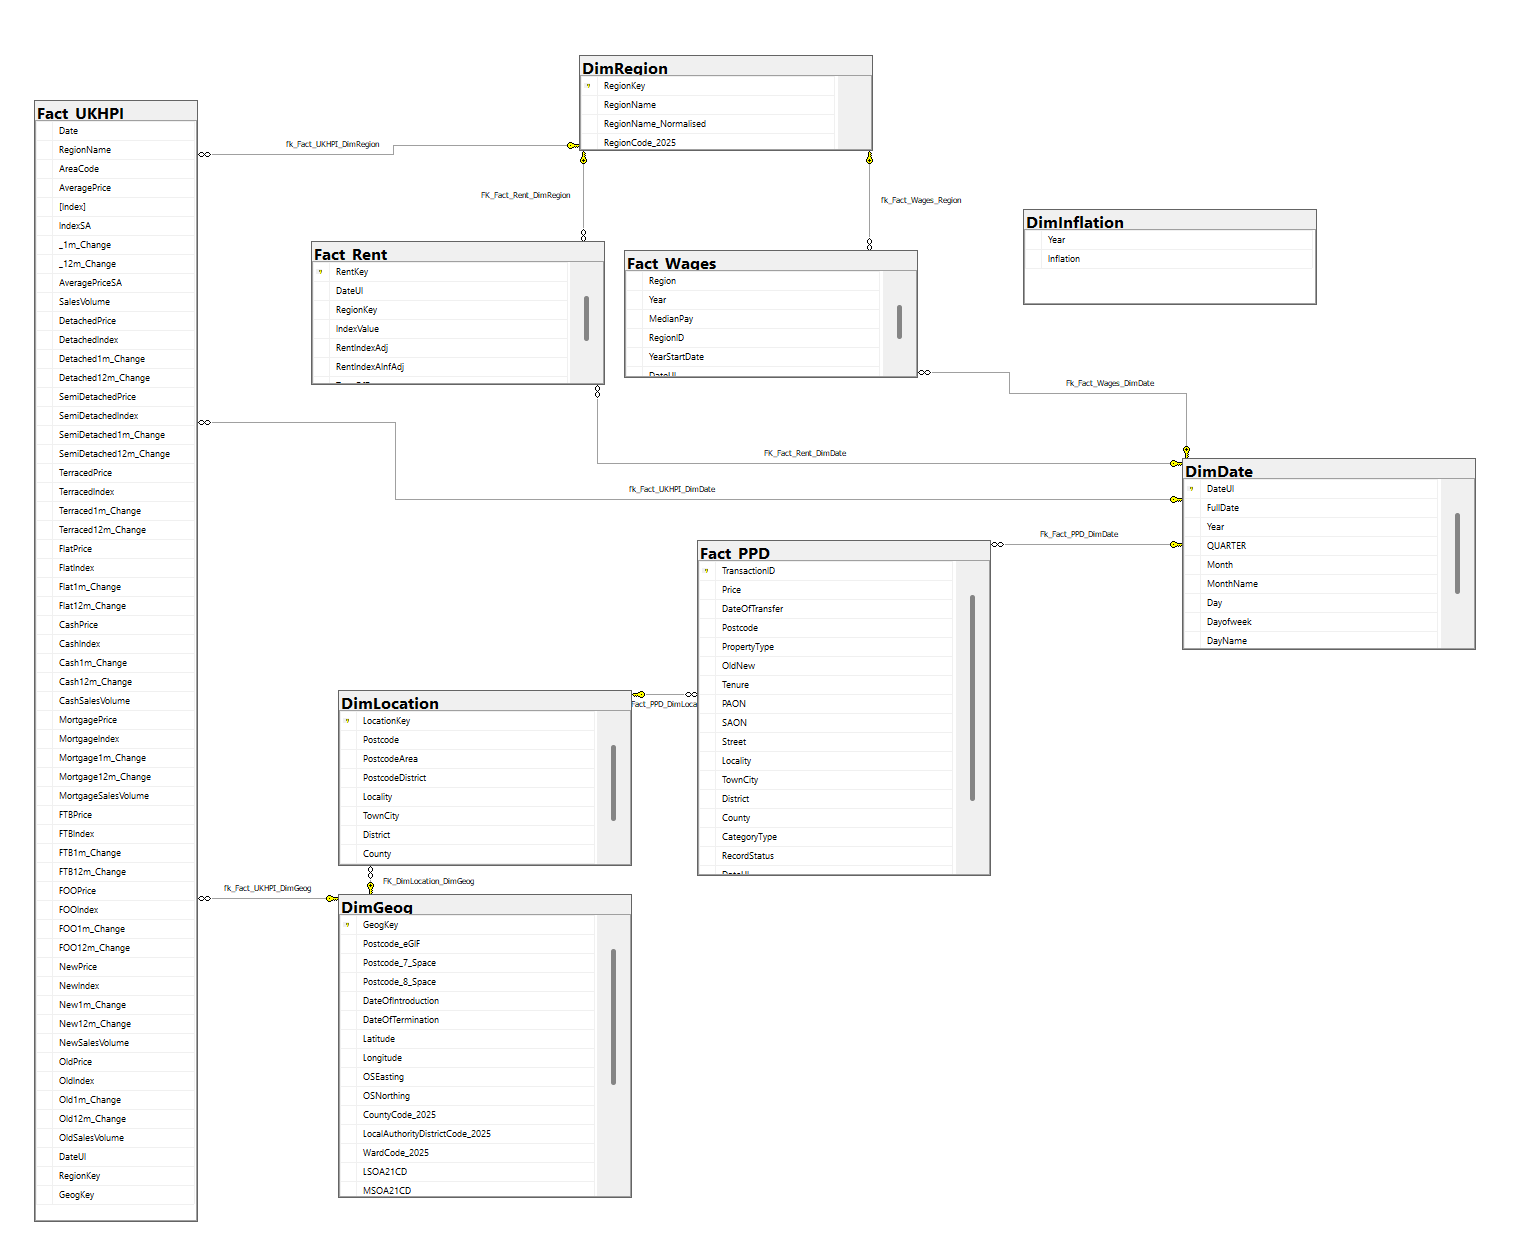
2.4 Data Model Structure
I joined my tables using these surrogate keys. Surrogate keys where made by when creating the dimension tables, then referenced as foreign keys in the related tables, allowing the dataset to be joined efficiently.
Here is my database diagram from SSMS:
| Primary Key (Table) | Key Format | Foreign Key |
|---|---|---|
| DateUI (DimDate) | Concatantion of Day,Month,Year based on unique dates from Fact_PPD | Fact_PPD, Fact_UKHPI, Fact_Wages, Fact_Rent |
| LocationKey (DimLocation) | Surrogate Key 1,2,3… based on unique postcodes from Fact_PPD | Fact_PPD |
| RegionKey (DimRegion) | Surrogate Key 1,2,3… based on unique locations from Fact_PPD | Fact_PPD, Fact_UKHPI, Fact_Wages, Fact_Rent |
| GeogKey (DimGeog) | Surrogate Key 1,2,3… based on matched postcodes in Dim_Location | Fact_Location |
2.5 Main SQL Query of House Dashboard using SQL Server and SSMS
The table was created by combining the inflation data with inflation data. Multiple joins were used to attain the correct columns to be imported into Tableau:
SQL Query: Inflation data by region and year
# Inflation data by region and year
WITH Inflation AS
(
    SELECT
        YEAR([Date])      AS [Year],
        RegionKey,
        AVG([Index])      AS YearlyIndex
    FROM Fact_UKHPI
    WHERE RegionKey IS NOT NULL
    GROUP BY YEAR([Date]), RegionKey
),

## Index data 2021 by region
Inflation2021 AS
(
    SELECT
        RegionKey,
        YearlyIndex
    FROM Inflation
    WHERE [Year] = 2021
)
### Creating the view
SELECT
	d.Year,
	f.Price,
	f.Price	* (i.YearlyIndex/j.YearlyIndex)AS Standardto2021Price,
	f.Street,
	g.ActualTownCity AS TownCity,
	g.LADName AS LocalAuthority,
	g.Postcode_eGIF AS Postcode,
	g.Longitude,
	g.Latitude,
	f.PropertyType,
	f.OldNew,
	f.Tenure,
	f.TransactionID

	FROM Fact_PPD f

LEFT JOIN DimDate d ON f.DateUI = d.DateUI
LEFT JOIN DimLocation l ON f.LocationKey = l.LocationKey
LEFT JOIN DimGeog g ON l.GeogKey = g.GeogKey
LEFT JOIN Inflation2021 i ON f.RegionKey = i.RegionKey
LEFT JOIN Inflation j ON d.Year = j.Year AND f.RegionKey = j.RegionKey

WHERE g.ActualTownCity = 'Bath'
AND PropertyType <> 'O'
    AND Tenure <> 'U'
    AND CategoryType = 'A'
2.6 House Dashboard Tableau Overview
- The Bath dataset was medium sized so I opted to calculated medians within Tableau. This allowed true medians to be used (opposed to the weighted values in Dashboard #1).
- To compare areas in Bath, I needed to create areas. This was done in Tableau by grouping postcodes together into approximate areas from where they existed on the map.
Tableau Calculated Fields
# Filter Parameter  (House Dashboard)
IF [TenureP] = "All" THEN TRUE ELSE [Tenure] = [TenureP] END

# Average Adjusted Price (House Dashboard)
SUM([Standardto2021Price])/COUNT([Standardto2021Price])

# Ranking Postcodes (House Dashboard)
RANK(MEDIAN([Standardto2021Price]), 'desc')

# Price Banding Bins (House Dashboard)
IF     [Price]<= 250000 THEN '0-250k'
ELSEIF [Price]<= 500000 AND Price > 250000 THEN '250k to 500k'
ELSEIF [Price]<= 1000000 AND Price > 500000 THEN '500k to 1M'
ELSEIF [Price]<= 5000000 AND Price > 1000000 THEN '1M to 5M'
ELSE '5M+' END
3. Key Findings
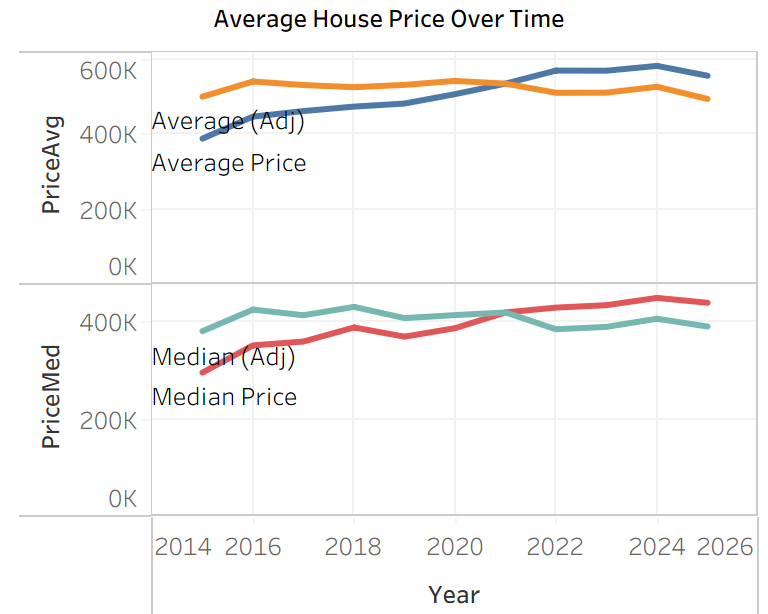
3.1 House Prices in Bath have risen real-time, but inflation adjusted costs have remained constant
Median and Mean adjusted house prices appear to be relatively flat over the decade. Prices adjusted for inflation have increased for median from 381k to 391k and decreased for mean from 502K to 496K over this 10 year period. This suggests house prices have been generally reflecting inflation over this period. The decrease in mean and increase in median suggest there is a potentially a change in composition of the properties sold in Bath, particularly the shift in new builds.
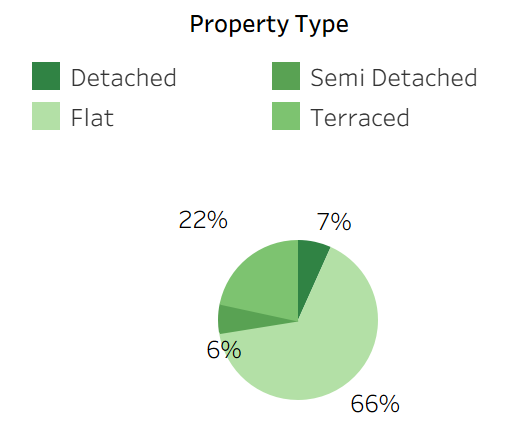
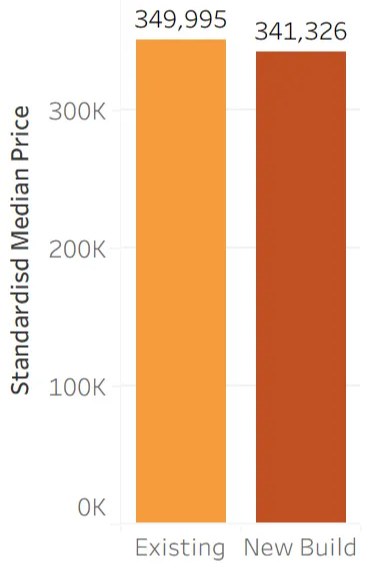
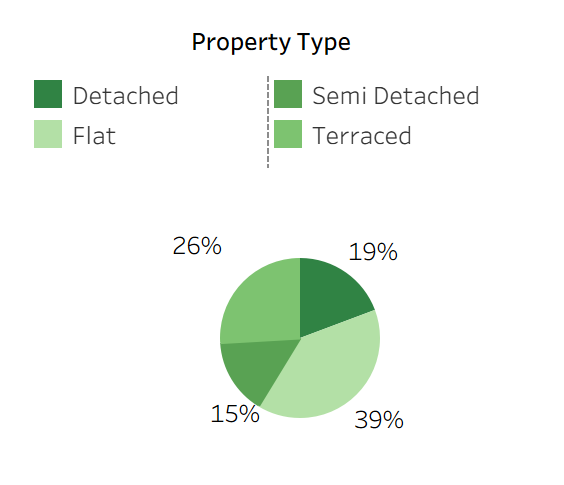
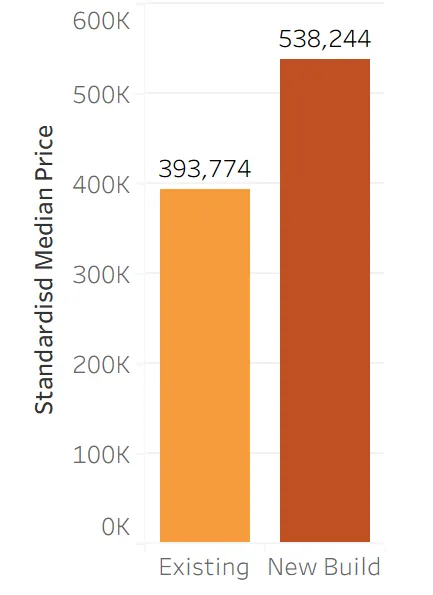
3.2 New build Change Cluster and Increase in Price in 2015-2025
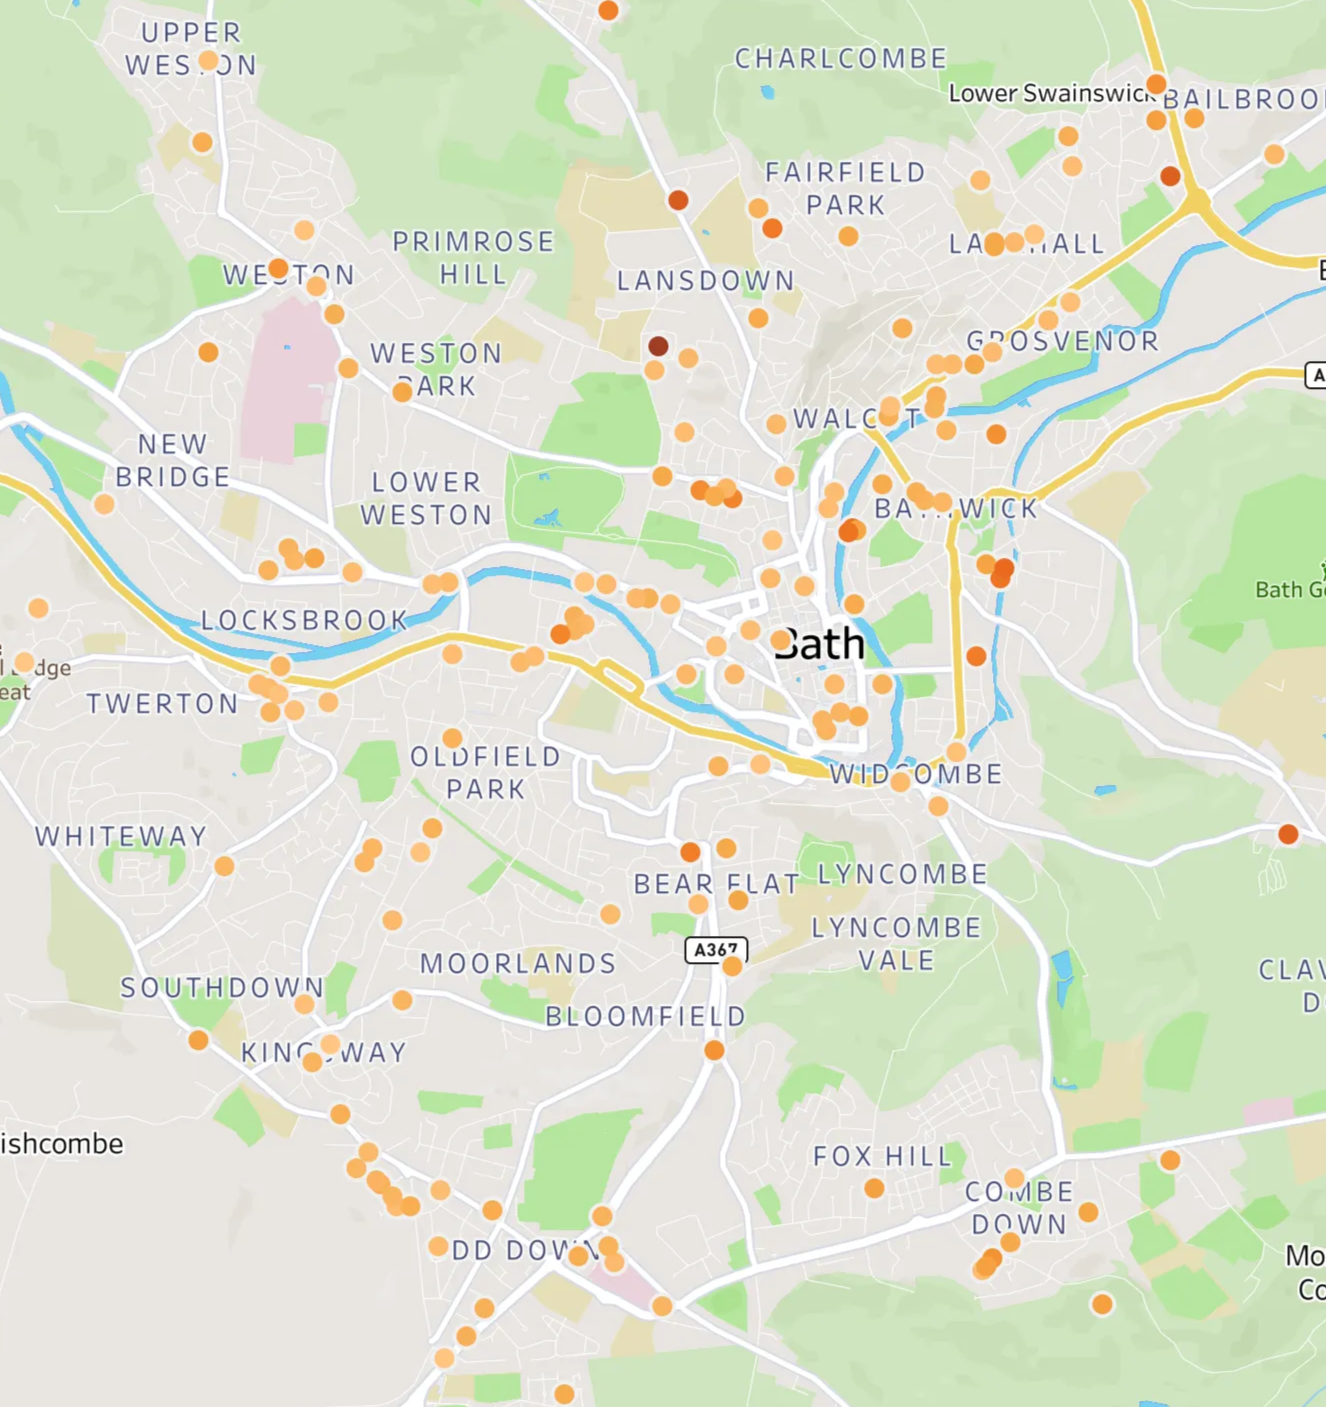
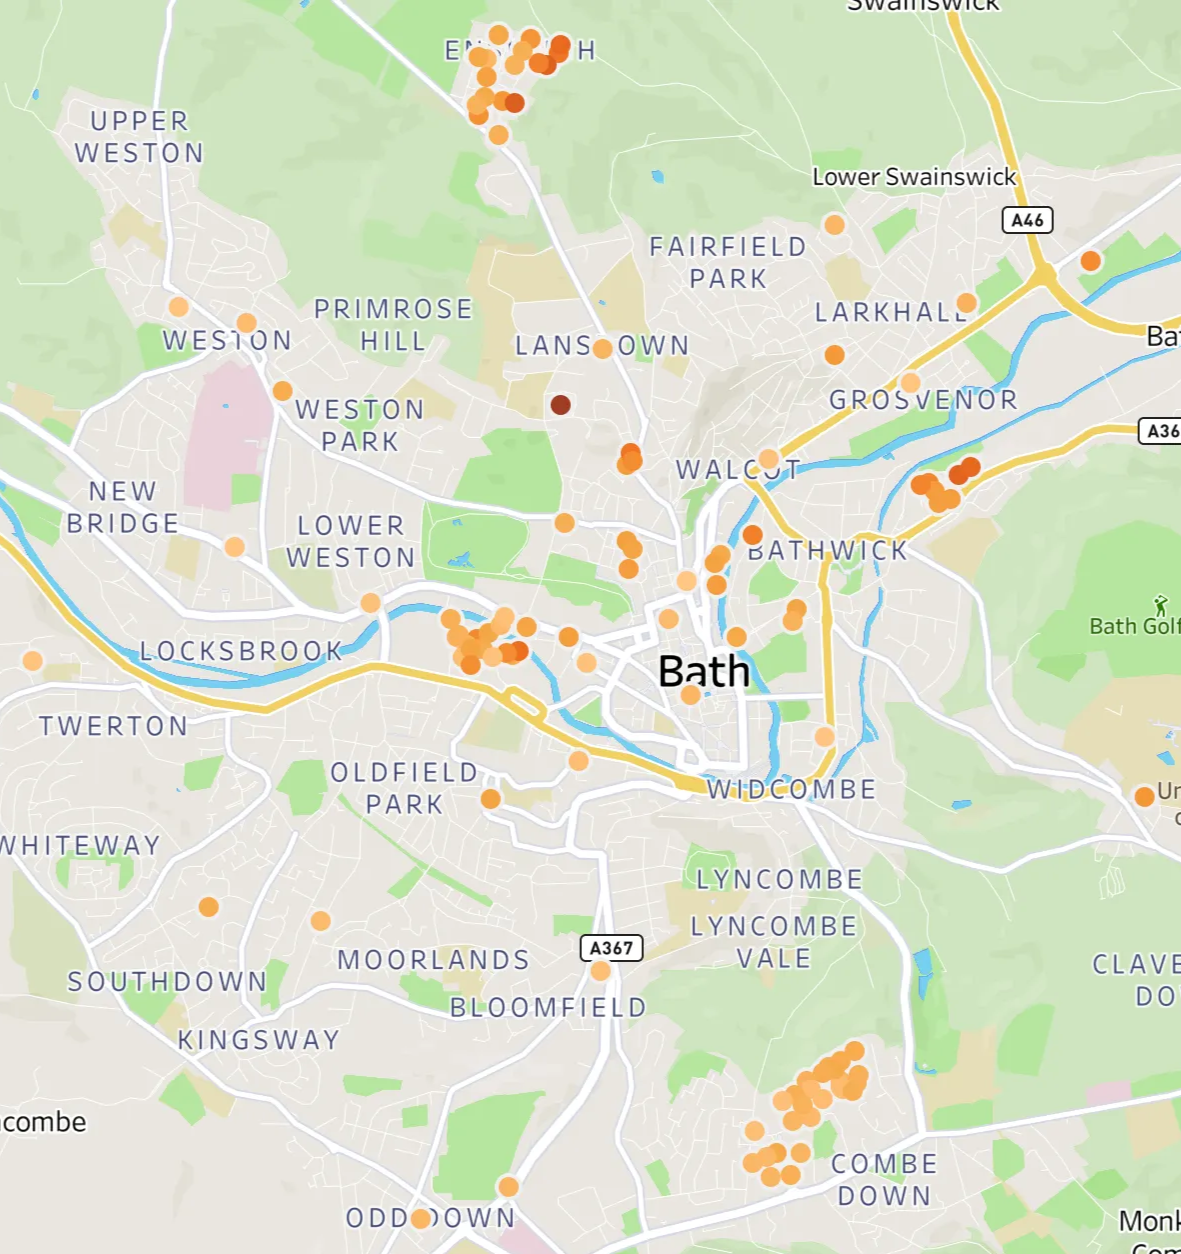
New builds used to be distributed more dispersed around Bath (map A). 66% of these properties sold were flats. In this period 1046 new builds were sold. From 2015, 1401 were sold. There is also a large change in distribution, with a clear clustering in postcodes within Coombe Down, Ensleigh, to the East of Twerton and to the East of Bathwick (Map B). These areas are new residential developments and have caused a greatly different proportion of property types sold (chart C and D). The change in property type seen is likely the reason for the large change in price of new builds inflation adjusted prices of existing : new build has changed from 350k : 341k to 393k : 538k over these year brackets (Charts E and F).
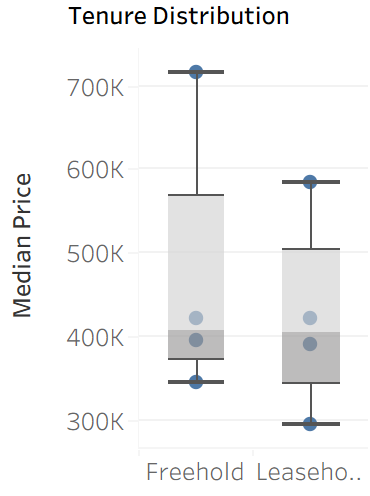
3.3 Freehold/Leasehold Price Changes by Property Type
Properties that are leasehold have a similar median value to freehould. Leasehold properties have a lower range in their value, however, both ends of the box are lower, meaning lower spec and higher spec properties are cheaper compared to freehold properties. Both terraced properties and semi detached properties have a similar median across freehold and leasehold. However, detached houses and flats both tend to be not as valuable overall when they are a leasehold property.
3.4 Area Comparison Weston & Bear Flat
From my previous Countrywide Dashboard, the median flat in London is £425k.
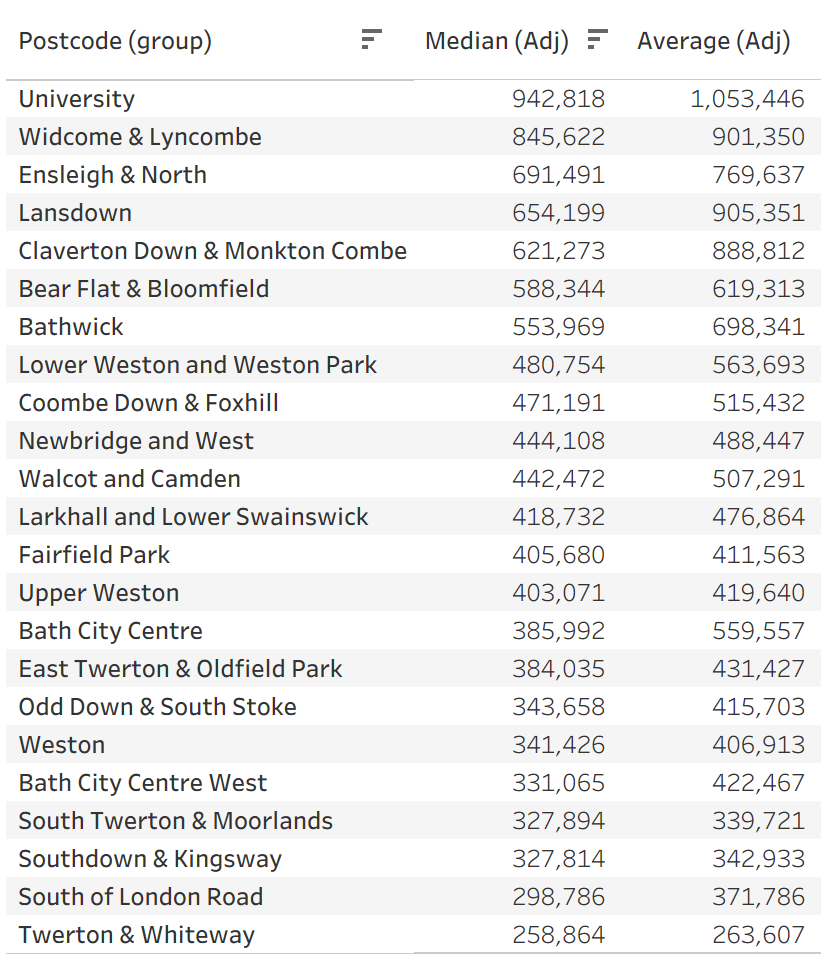
I used a helper dashboard to overview the median and mean prices of the areas of Bath. I noted that Bear Flat was more expensive than Weston and wanted to investigate further.
One interesting location was Bath City Centre. I assumed this would be expensive, however the median portrays a different story. This is likely due to the proportion of flats (81%). It has a notably high mean comparatively to the median, which could indicate high priced properties being in this area.
3.5 Area 1: Weston Overview
Weston is a mix of property types with generally a low proportion of flats and a high proportion of terraced houses. The majority are freehold and there are very few new builds in the area. The majority of houses in Weston fit the median price of £425k, with the median adjusted prices being £416k. Of the properties being sold, most are within the bucket of £250k to £500k. Prices have risen in Weston over time, however they are generally quite stable. The house price to income ratio for Weston is 11 which is high and the area is generally unaffordable on a national scale.
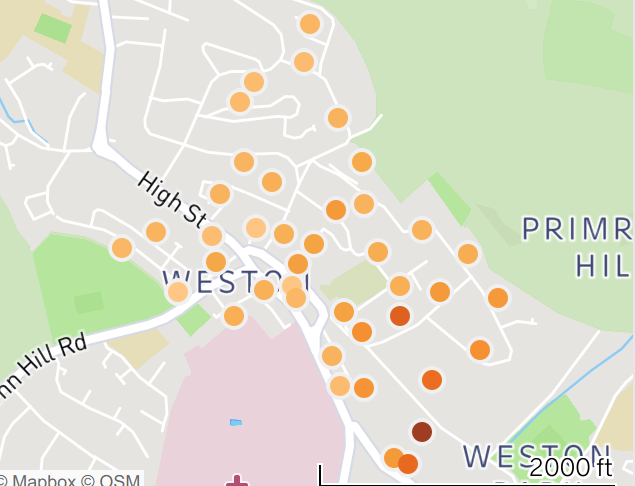
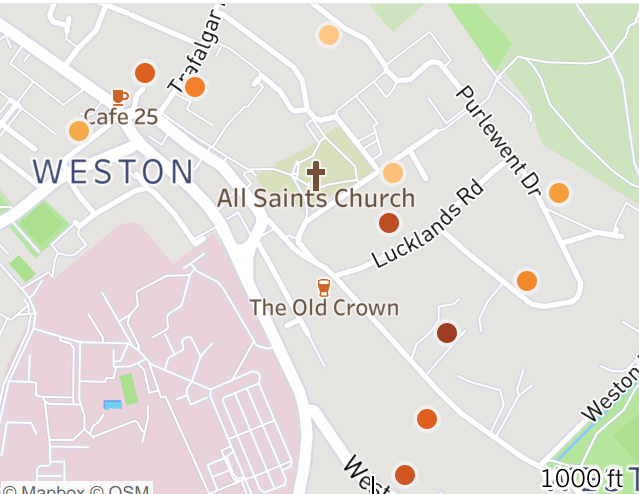
3.6 Detached Houses in Weston are only located to the South East
Looking at the heatmap of Weston the majority of dark red and orange postcodes are towards the South East. Originally I thought houses closer to the city centre were more expensive, which could be a factor, but likely a big factor is the fact that all postcodes containing detached houses are in the South East.
3.7 Area 2: Bear Flat Overview
Bear Flat is a very similar mix of property types to Weston, with a similar proportion of freehold/leasehold properties and almost no new builds. However, the area is much less affordable than Weston with a house price to income ratio of 19. This is very high and is much more than all of the regional averages found in Dashboard #1. The majority of houses being sold fit within the bracket of £500k to £1m, with the median adjusted prices being £622k (much above the budget of £425k). One thing to note is that more properties are of a similar price compared to Weston, seen in the shorter boxes of the boxplot. Similarly to Weston, prices have gone up in Bear Flat over time with the inflation adjusted prices remaining stable.
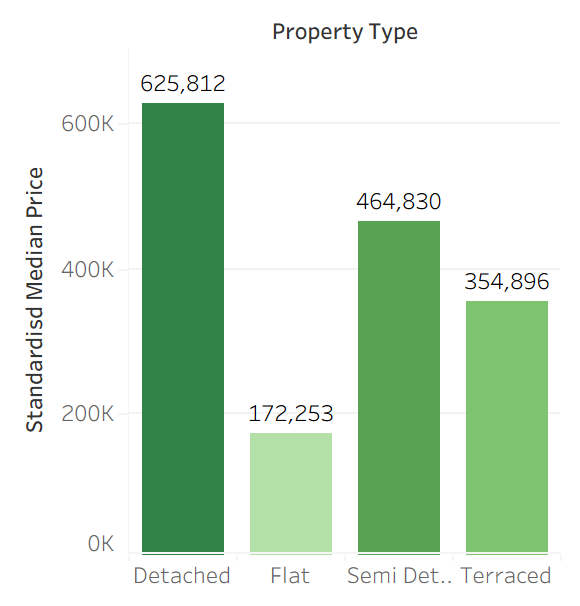
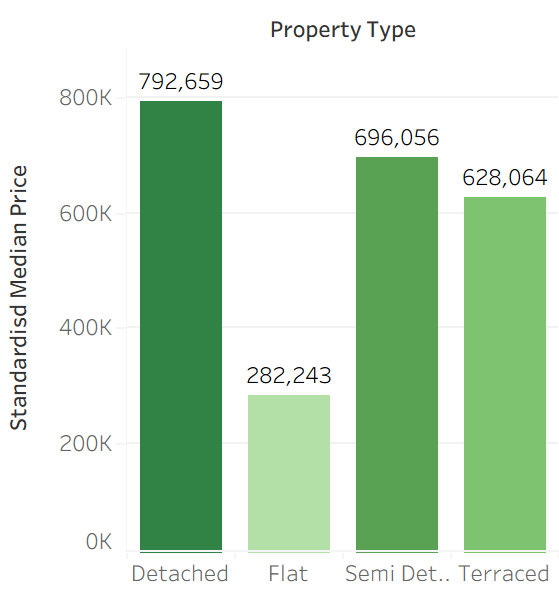
3.8 For £425k, Terraced Houses and Flats Are Affordable in Weston, only Flats in Bear Flat
Looking within the Property Type tooltip, flats and terraced houses in Weston would be affordable to someone selling a £425k flat in Ealing. A semi detached is also within reason if the buyer is willing to or able to take out a larger mortgage. Bear flat houses look expensive in most categories and only flats appear affordable to the buyer.
4. Conclusions
Ultimately, many other factors have determined our preferences of where to live other than just finances, however this project has certainly given good context of areas within Bath:
- The market in many areas of Bath is dominated by existing properties. New builds are only an option at a price premium in a newly developed estate, rather than a newer house amongst the city.
- If a buyer plans to be living in Bath in the long term, prices remain stable within Bath making it a good time to buy. For those planning to buy in the short term or as an investment property, the houses are expensive and are unlikely to appreciate.
- There are big decisions to be made about the type of house we want to move into. If a flat is sufficient then areas such as Bear Flat will be accessible, even at a saving from Ealing, however, if the intention was to move to a house, certain areas such as Bear Flat could be priced out. It is important to remember when buying a house certain areas will have cheaper detached houses and others expensive ones which could come from numerous factors. Just because an area such as Bear Flat had expensive houses, doesn’t mean certain properties won’t come up for sale at a cheaper price.
5. Next Steps for Future Analysis
- I looked into new builds and their increased price in Bath between 2015 to 2025. Prices appeared to be higher for new builds of all property types which I could identify from the dashboard. This is useful information, however, a limitation of the dashboard is all analysis is broad. This was useful for what I want, however, I should really make my next steps delving into specifics with a more refined, specific brief.
- A property’s size and number of bedrooms are big factors which greatly change the price of a house. These metrics would have been very useful to include in my data model if the data could be acquired.
- Metrics for percentage change over time would be useful. For instance, has the percentage change of one area in Bath been greater than another? If the user wanted an investment property in Bath, is this possible?
6. Challenges & Lessons Learned
- Initially I started creating tools in Tableau that were useful to me, however the UI was very clunky. When this was tested with someone not used to the layout I had to change this quite considerably. I needed to test this sooner and ensure that it was intuitive.
- I lacked a focus at the start to what I was going to present. Many of my needs for housing I am quite open about, however some decisions delve more into the private realm. It was useful creating Dashboard #1 and using this to find the “average flat price in Ealing”, having a test subject made answering the questions much easier.
- Originally I created the dataset with month and year details, I should have taken through date from my DimDate table and then used this in Tableau with the year extracted. This could have helped me answer more questions about times selling in certain times in the year of month. As the data was not aggregated there wasn’t really a reason to not bring this data through.
- There were many worksheets on this dashboard and it was initially slow on the refresh. I parametrised my filters to speed up the dashboard so it didn’t have to query the database on filter changes. Through using the dashboard more thoroughly, I found that ruling out detached houses may have been useful. This could have been a filter and removing this as a parameter would benefit the user looking for prices of multiple types of property.
Appendix: Links to data
[1] The Complete Price Paid Data (PPD): https://www.gov.uk/government/statistical-data-sets/price-paid-data-downloads
[3] RPI Housing Rental Index from 1987: https://www.ons.gov.uk/economy/inflationandpriceindices/timeseries/dobp/mm23
[4] Index of Private Rentals from 2005: https://www.ons.gov.uk/datasets/index-private-housing-rental-prices/editions/time-series/versions/41
[5] Private Rent Summary Statistics April 2021 to March 2022: https://www.ons.gov.uk/peoplepopulationandcommunity/housing/datasets/privaterentalmarketsummarystatisticsinengland
[6] UK HPI File Back from 1995:
Dan Druce 2026